Table


|
Table |
|
|
The table displays the values from your corporate performance management for the selected sales structure and product structure and the set active time span. The number of columns and rows and their type vary according to the selected view (table type) and the display options. Each column can be sorted in ascending or descending order using the column header. The sorting of the values always relates to the respective hierarchy levels of the field structure. You will find the top-down/bottom-up planning and the planning across data streams functions in the CP-Tools.
In the Web Client portal you can identify the table content type by the following symbol:
The following table types (views) are available:
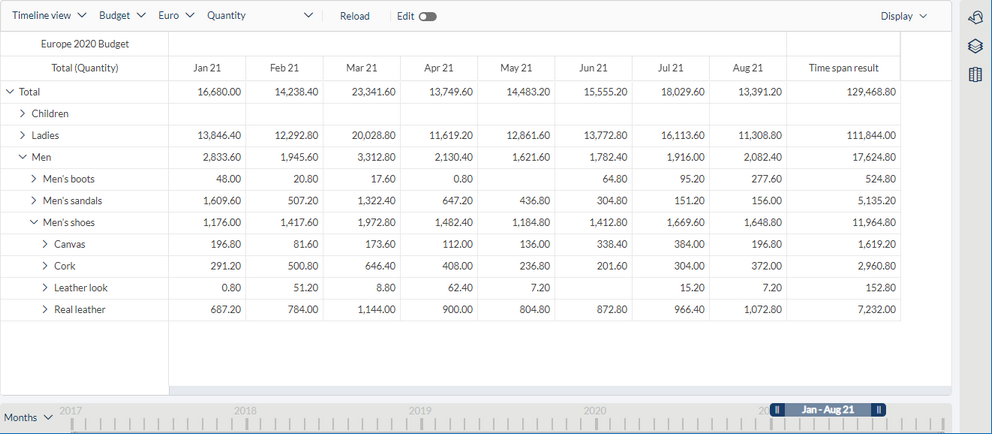
Timeline view The timeline view displays the selected sales structure or product structure in the rows, and the time steps of the active time span in the columns.
Column view The column view displays the selected sales structure or product structure in the rows, and compares the data streams and analysis rows in the columns. You can define the individual columns using the "Edit column definition" function in the CP-Tools. To open the column editor for a column, right-click that column and then click "Edit".
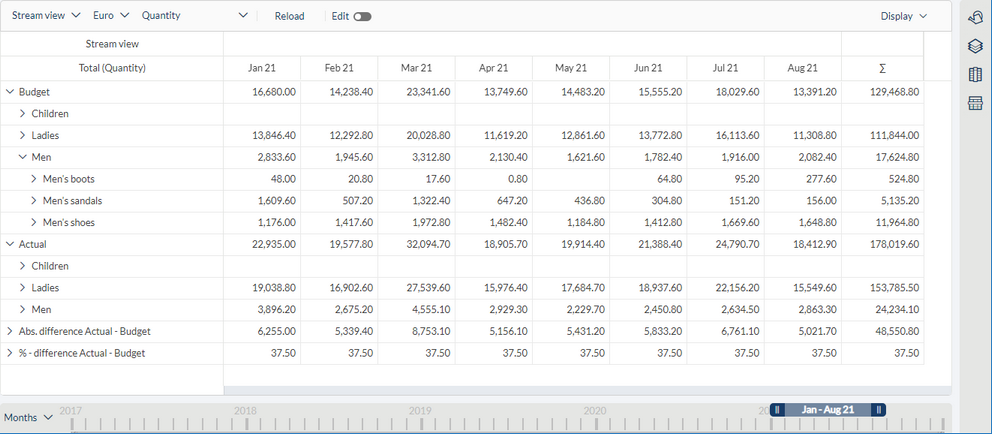
Stream view The stream view displays the data streams and analysis rows in the rows, and the time steps of the active time span in the columns. Below each of the data streams and analysis rows you can see the selected sales structure or product structure in rows. You can define the individual rows using the "Edit row definition" function in the CP-Tools. To open the row editor for a row, right-click that row and then click "Edit".
Cross view The cross view displays the structure of the selected tree in the rows in terms of the structure of the other tree in the columns.
Measures view The measures view displays the selected measures for the set time span and the underlying product or sales structure in the rows. The displayed columns are defined individually using the column editor.
|