hi-chart Graphics View


|
hi-chart Graphics View |
|
|
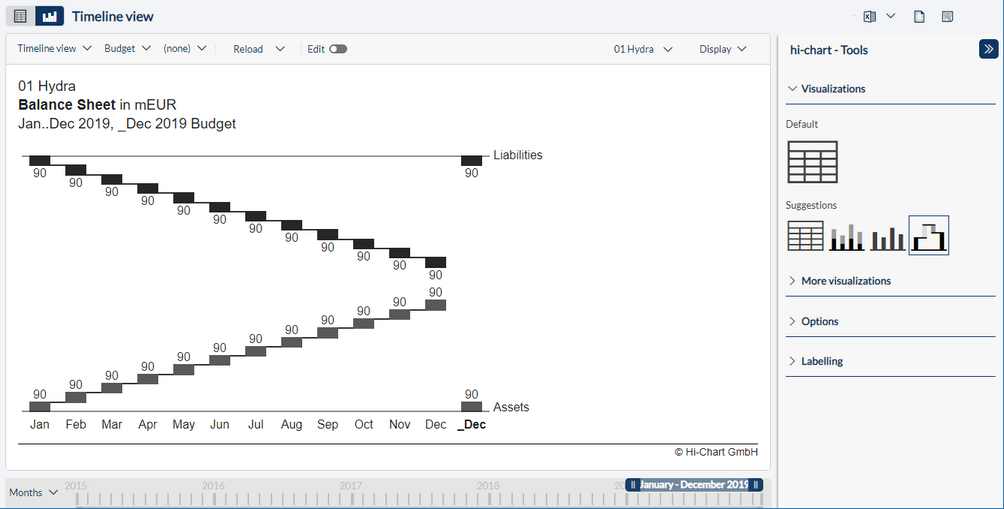
With the integration of hi-chart, the professional IBCS reporting solution by Corporate Planning, a graphic display of the data and their organisational structure is available for all tables.
To display your data as a chart, click the hi-chart graphics view button above the table.
Since hi-chart is a very powerful solution, it chooses the optimum visualization for the data automatically according to the table type and the complexity of the data.
In the hi-chart Tools on the right, you can choose from other visualizations, define the display of the data and add labelling.
For details on exporting, printing and saving your table, please read the respective section under Table.
|