hi-chart Tools


|
hi-chart Tools |
|
|
In the hi-chart tools, you can adjust the display of the chart in the following sections:
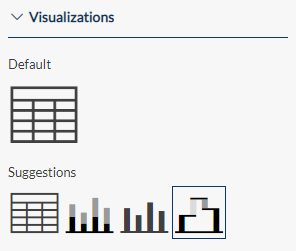
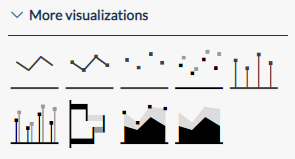
Visualizations Depending on the table type and the complexity of the data, the optimum chart display is selected automatically (default). If other meaningful visualizations of your data are available, these will be shown under suggestions.
You can choose from the following visualizations:
Options Depending on the visualization, the following display options are available for your column and row structure:
Hierarchy nodes in columns: Defines whether the node elements of the display are shown in the columns. Hierarchy nodes in rows: Defines whether the node elements of the display are shown in the rows.
With the Multichart option, you can specify whether a separate chart should be displayed for each element of the dimension to be selected (e.g. time, structure, etc.)..
Labelling Under Labelling, you can add text to different parts of the chart. Enter the desired text or use one of the variables listed below. There are three types of labelling:
To display predefined information about the underlying table, the following variables are available:
|