Report


|
Report |
|
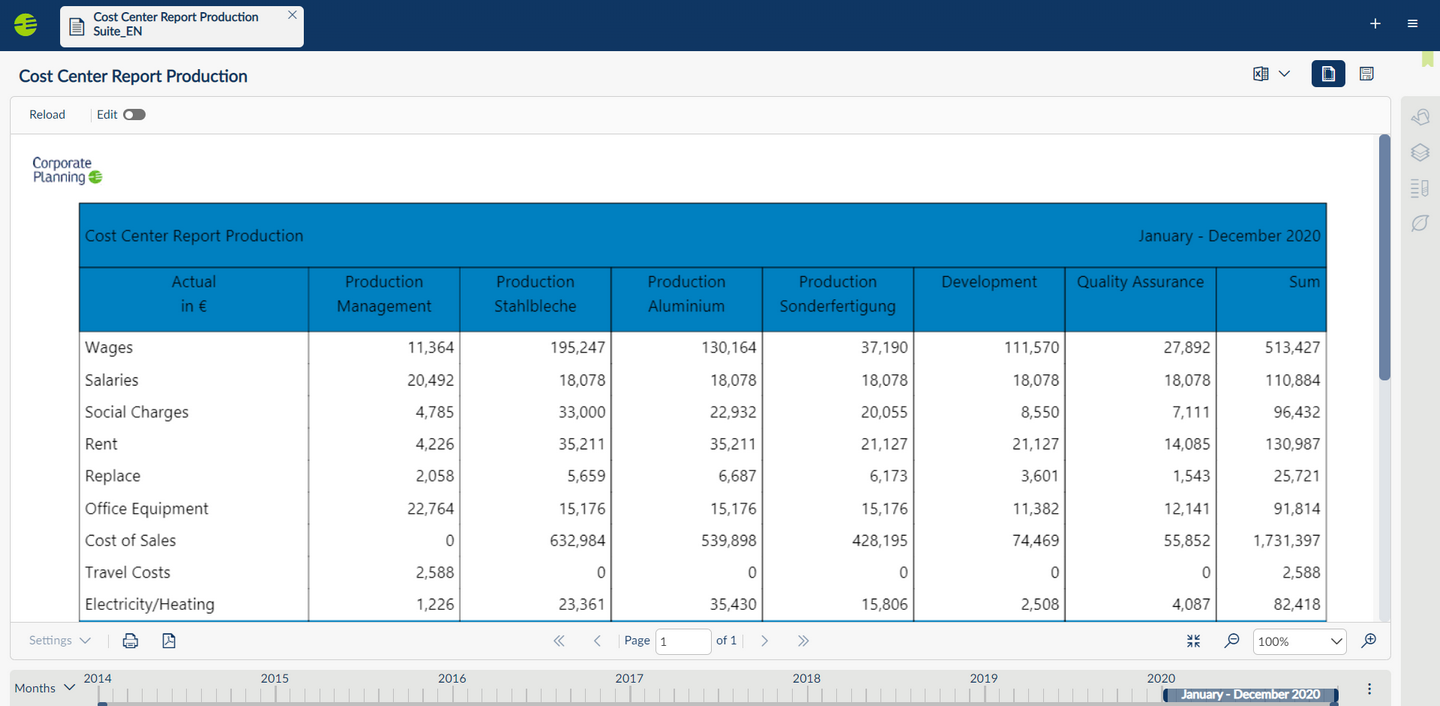
Reports are displayed in PDF and their layout is predetermined (table view/analysis). In a report, you can only change the time span and, depending on your access rights, enter data. You cannot change the row or column layout of the report.
In the Web Client portal you can identify the report content type by the following symbol:
Time navigation You can change the active time span of the report by using the time slider below the report. To find out more, please read Time Navigation.
Data input To plan values in a report, select "Edit" mode and open the table view.
Planning functions In the table view of a report, the familiar "Planning across Data Streams" and "Top-down/Bottom-up" planning functions are available. To use these functions, deactivate the print view. In the table view, select the field you wish to plan and, in the CP-Tools, select the desired function. You can also display the "Structure information" and carry out a "Drill-down" there.
Jumping from the report to the table In saved reports you can now jump directly from the report to the corresponding item in the table. To do so, open the table view of the report and then right-click on the item, in any cell you like, to open the timeline view. This opens the table in a new tab, in which you can access all the familiar functions in the CP-Tools.
Jumping straight to the values in the timeline view is not only possible from items in reports; you can also do this by right-click on an item in a table.
All further options for working with the PDF report and for adjusting the layout are described in the following sections.
|